


Austin foreclosure filings rose faster this year than almost any metro in America. I went looking for why. The answer had very little to do with the housing market.
Compiled September 2026. Data through August 2026. Questions about what this means for you? Call or text 512-599-1979, or email Chloe@ChloeChiang.com.
TL;DR
That increase is accurate, and it is the last domino in a line that started falling somewhere else entirely. Here is what the rest of the data says once you follow it back. Figures reflect Unlock MLS data through August 2026 and mortgage rates as of late September.
Download the full report as a PDF if you would rather read the designed version.
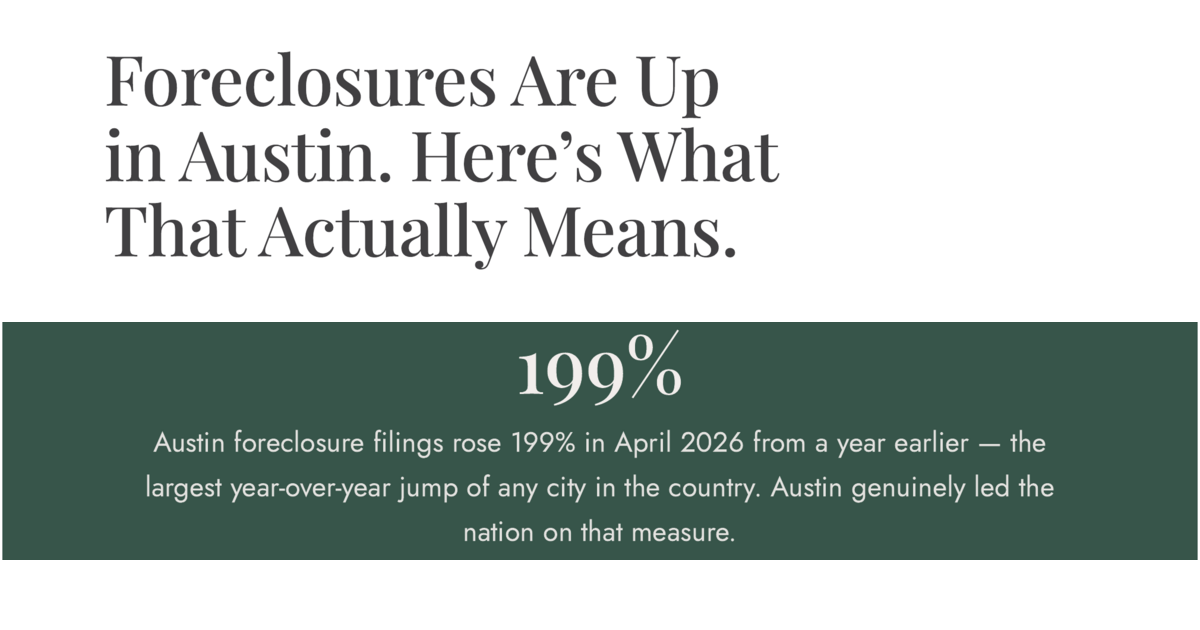
199%: the fastest jump of any U.S. city
Austin foreclosure filings rose 199% in April 2026 from a year earlier. Austin genuinely led the nation on that measure.
The four numbers that frame everything
- 0.26% of U.S. homes had a foreclosure filing in 2025. At the 2010 peak it was 2.23%. Source: ATTOM.
- Prices fell 25% from the 2022 peak. Source: Unlock MLS.
- The monthly payment fell 10%. Rates ate the rest. Source: Freddie Mac.
- $1,763 more per month to own the median home than to rent the median apartment. Source: Unlock MLS and Pew.
Seven things to know
1. Foreclosures are climbing off the lowest base in twenty years.
In 2025, 0.26% of American homes got a foreclosure filing. In 2010 it was 2.23%, nearly nine times higher. Even 2019 ran hotter at 0.36%. When you start from almost nothing, any increase looks enormous in percentage terms. Source: ATTOM year-end foreclosure market reports.
2. Prices fell 25% from the peak. Buying got 10% easier.
The median Austin home went from $550,000 in May 2022 to $412,000 in August 2026. Over the same stretch mortgage rates went from 5.25% to about 7%. The monthly payment moved from $2,430 to $2,193. Most buyers never felt the correction because the rate ate three-quarters of it. Source: Unlock MLS and Freddie Mac.
3. The mortgage is the last bill people stop paying.
Almost 13% of credit card balances are seriously past due. For mortgages it is under 1%. People stretch the card, then the car, then the house. Rising mortgage trouble means the stress already tore through everything else first. Source: Federal Reserve Bank of New York.
4. The trouble sits with people who bought at the peak with almost nothing down.
FHA loans let you buy with 3.5% down. Those borrowers are now 11.79% delinquent against 2.72% on conventional loans, more than four times the rate. About 65% of Austin FHA loans from 2022 are underwater. If you bought before 2020 or put 20% down, you almost certainly have equity and significantly less risk of foreclosure. Source: Mortgage Bankers Association.
5. Their mortgage payment never went up. Everything around it did.
Texas home insurance rose 74% while incomes rose 11%. Property tax bills can climb in a year your home loses value. Childcare in Austin costs $24,891 a year. Student loan payments came back after a 43-month pause. A fixed mortgage stays fixed. The escrow account attached to it does not. Source: Rice University Kinder Institute.
6. It is not the job market.
Austin's is the best of any big metro in America. Austin added 27,200 jobs in 2025, twice the Texas rate and four times the national rate, with unemployment at 3.7%. Foreclosures are rising in a city where people are getting hired. Source: Opportunity Austin.
7. People are not leaving Austin. They are moving one county over.
More people moved out of Travis County than into it. Meanwhile that same migration drove 60% of Williamson's growth, 72% of Hays', and 83% of Bastrop and Caldwell's. Nobody expects every New Yorker to live in Manhattan. Austin is growing its own boroughs. Source: U.S. Census Bureau via City of Austin.
CHLOE'S TAKE
“My client sent me this video about Texas foreclosures and it sent me down this worm hole, and I'm so glad it did. Yes, foreclosures are up. They are up from the lowest level in two decades, they are concentrated in people who bought at the top with three percent down, and what broke those families was insurance and childcare and medical bills, not their mortgage. Meanwhile we added more jobs than any big city in America and prices have sat flat for seven months. This is a cost-of-living story that happens to show up on a mortgage statement.”
What the headline says, and it is true
Austin today: 1 in 2,000 homes with a foreclosure filing. The 2008 crisis peak in the U.S. was 1 in 45, roughly 44 times higher than today.
A percentage increase depends entirely on where you started. Austin's April 2025 base was historically low, because foreclosure activity had been suppressed for years by pandemic moratoriums and forbearance programs. Go from a very small number to a slightly less small number and the percentage looks enormous.
Austin ranked eighth on the measure that matters
The same analysis that produced the 199% figure ranked Austin eighth in actual foreclosure share among metros with at least a million residents. Austin came first in how fast the number moved and eighth in how big the number is.
| Austin | Texas | United States | |
|---|---|---|---|
| Foreclosure rate | 1 in 2,000 (Apr '26) | 1 in 2,445 (Aug '26) | 1 in 3,569 (Aug '26) |
| Rank | 8th among metros over 1M | 4th worst state | |
| Direction | Fastest increase in U.S. | Most starts of any state | Up 13% year over year |
| Versus 2010 peak | About 44x lower | About 18x lower | About 13x lower |
Source: The Real Deal citing TRD Data, May 2026; ATTOM August 2026 U.S. Foreclosure Market Report and year-end reports.
Austin runs hotter than Texas and Texas runs hotter than the country. Both statements are fair. All three sit far below anything resembling a crisis.
The 2008 comparison, honestly
Austin barely participated in the last housing crash. Prices fell 8.5% peak to trough while Las Vegas lost 63.9%, Phoenix 56.4%, and Miami 52.2%. Texas lending laws had limited the kind of no-money-down borrowing that devastated those markets.
Austin's current correction of about 25% is roughly three times larger than what Austin experienced in 2008. This is a bigger price event for this city than the last crisis was.
What makes it different is equity. In 2008 borrowers had almost none, so a price decline meant they owed more than the house was worth and had no way out except default. Today about 1.8% of American mortgages are underwater against 22.8% at the 2011 peak, and the average mortgaged homeowner holds roughly $310,500 in equity. A homeowner with equity who hits trouble sells the house. That is why a larger price correction is producing a fraction of the foreclosures.
Source: Zillow Home Value Index via Fortune; Unlock MLS August 2026; Cotality Homeowner Equity Insights Q2 2026.
Part 1: Who is actually in trouble
CHLOE'S TAKE
“If you bought before 2020, or you put twenty percent down, you are almost certainly not in this group. That describes most homeowners in this city. The people in trouble are a narrow slice who bought at the top of the market with the smallest down payment the bank would accept, and the market moved against them before they built any cushion.”
The loan type does most of the work
FHA loans let buyers in with 3.5% down. That is the entry ramp to homeownership for a lot of families, and it also means no cushion if prices dip.
- 11.79% FHA loan delinquency rate, mid-2026, the widest gap versus conventional since 2021.
- 2.72% conventional loan delinquency rate, same period.
- About 75% of all underwater U.S. mortgages are FHA or VA loans.
FHA lending lands right in Austin's entry-level tier. The $571,550 FHA ceiling sits well above both the $412,000 metro median and the $560,000 City of Austin median, which is exactly where the distress shows up.
The year you bought matters more than what you earn
Everyone who bought in a given year walked into the same prices and the same interest rates.
- 65% of Austin's 2022 FHA loans are underwater today. A 2019 buyer is sitting on years of gains instead.
- 4% to 9% negative equity estimate for Austin's 2021 and 2022 buyers, the local exception to the national picture.
And it concentrates at the lower price points
Realtor.com found the metros with the most foreclosure listings are the affordable ones, where buyers came in with the thinnest margins.
Source: Mortgage Bankers Association Q2 2026; HUD 2026 FHA loan limits; Cotality Homeowner Equity Insights Q2 2026; Realtor.com State of the Foreclosure Market, July 2026.
Part 2: What actually broke them
CHLOE'S TAKE
“Somebody who bought in 2022 with a fixed-rate mortgage did not get a rate increase. They got an insurance increase, a tax increase, a childcare increase, a health premium increase, and a student loan payment that reappeared after three years of not existing. Their mortgage payment is identical to the day they signed. Their escrow is not. That is the whole story.”
Insurance is the biggest single squeeze in Texas
Insurance costs have climbed far faster than incomes, and the gap keeps widening.
- Up 74% Texas home insurance growth, 2009 to 2024 in real terms, against 11% income growth.
- 4.6% share of median income spent on premiums in the typical Texas county, up from 2.9%.
- Up 60% what the median Texas homeowner is paying in 2024 versus 2019, against 30% nationally.
- About 7 million Texas households, roughly two-thirds of the state, priced out of their county's median home once insurance counts.
Source: Rice University Kinder Institute; Federal Reserve Bank of Dallas.
Your tax bill can rise while your home loses value
- 1.65% to 2.07% Travis County's effective property tax rate, an average bill near $10,800.
- 10% the rate at which Texas caps homestead appraisal increases each year, which sounds like protection.
- Up 5.48% Travis County's 2026 appraisal roll increase, even as the market softened.
Because assessed values lagged during the boom, many homes are still catching up to market value, so the bill can go up in a year the market goes down. If you have not already, it is worth protesting your appraisal and confirming your homestead exemption is on file.
Then everything else arrived at once
Several more cost pressures landed on top of insurance and taxes at the same time.
- Up 24% average requested increase for 2026 Texas ACA marketplace health plans, the largest since 2018.
- 44% higher risk of housing instability the following year for people with medical debt, 23.7% against 5.8%.
- $24,891 annual childcare cost in Austin, the most expensive metro in Texas, up 18% since 2022.
- 3.6 million and counting U.S. borrowers who defaulted on restarted federal student loans, 20% of them also behind on a mortgage.
Source: Rice University Kinder Institute and Texas 2036; Federal Reserve Bank of Dallas; Travis Central Appraisal District; Texas Tribune citing KFF; Moon et al., JAMA Network Open, January 2026; SmartAsset; Federal Reserve Bank of New York.
The signal worth watching
Credit card delinquency is at a 15-year high. About 13% of balances are 90 or more days past due, up from 7.6% in late 2022 and closing in on the 13.7% peak that followed the 2008 crisis. Auto loans at 90 days are at the highest level on record.
Here is what holds across the data. New delinquencies are flat or falling. Deep delinquencies are rising. Oxford Economics described the card data as people already behind sinking deeper rather than new people falling behind, the same sentence Cotality wrote about mortgages. That pattern is the fingerprint of a permanent cost increase rather than a temporary loss of income.
| Debt type | 90+ days delinquent | Trend |
|---|---|---|
| Credit cards | About 13% | 15-year high, up from 7.6% in 2022 |
| Auto loans | Record high | Highest level on record |
| Mortgages | Under 1% | Last bill people stop paying |
Source: Federal Reserve Bank of New York Household Debt and Credit Report Q1 and Q2 2026; Liberty Street Economics, August 2026; Cotality Loan Performance Indicators.
CHLOE'S TAKE
“An insurance premium that went up seventy-four percent never goes back down. That is why the people already behind cannot climb out, and it is why I think this is a cost-of-living story more than a housing one.”
Part 3: It is not the job market
Opportunity Austin called the region the number one best-performing top-50 U.S. job market for job growth in 2025, adding 27,200 jobs, a 2.0% increase. That is their own framing of the region's 2025 performance, and it holds up: Austin outgrew every other large U.S. metro that year. Here is the sector breakdown over the trailing 12 months.
| Sector | Jobs added / lost | Change |
|---|---|---|
| Professional & Business Services | +9,200 | +3.2% |
| Construction & Natural Resources | +5,200 | +5.5% |
| Leisure & Hospitality | +2,700 | +1.8% |
| Government | Flat | |
| Information (tech, media, telecom) | −2,500 | −4.9% |
| Wholesale Trade | −1,400 | −2.5% |
That Information-sector decline is the closest thing in the data to the tech-layoffs story people reach for, and it is real. It is also small next to what the rest of the economy added: 9,200 jobs in one sector alone outweighs the entire Information-sector loss more than three times over.
One number complicates the picture and deserves to be here rather than left out. The count of unemployed Austin residents was running 11.3% higher than a year earlier as of mid-2026, even as the unemployment rate stayed low by national standards. Austin's labor force is growing fast enough that more people looking for work does not yet show up as a high rate, but it is a trend worth watching rather than waving away.
Source: Opportunity Austin Monthly Economic Indicators, September 2026, and April 2026 BLS benchmark revision.
CHLOE'S TAKE
“Every time foreclosures come up, somebody blames tech layoffs. That is a possible story in one sector. It is not the story for Austin as a whole. Some of the exact jobs people point to really are disappearing. Far more are being added somewhere else.”
Part 4: Prices fell. So why is nobody buying?
CHLOE'S TAKE
“This is the question I get most, and the answer surprised me when I ran the numbers. Prices came down twenty-five percent from the peak. Buying got about ten percent easier. The interest rate ate three-quarters of the discount before it ever reached a buyer.”
| Measure | May 2022 peak | Aug 2026 | Change |
|---|---|---|---|
| Median home price | $550,000 | $412,000 | −$138,000 (−25%) |
| Mortgage rate | 5.25% | About 7.00% | +1.75 pts |
| Principal & interest (20% down) | $2,430/mo | $2,193/mo | −$237/mo |
| All-in monthly cost (+ taxes & insurance) | $3,438/mo | $3,059/mo | −$379/mo (−11%) |
| Income needed to qualify | About $147,000 | About $131,000 | Still above median |
Note: taxes and insurance moved the opposite direction of price and rate over this period.
And renting got genuinely cheaper
Median rent is $1,296, down 16% since 2021. To own the median home costs $3,059, down 10% since 2021. That leaves a gap of $1,763 per month, which is the cleanest explanation for soft demand. A household doing the math is choosing between a payment that fell 16% and a payment that fell 10%.
So what would actually bring buyers back?
Running the scenarios is clarifying. Rates help most, and rates alone are not enough. The arithmetic needs several things moving together. Based on the $412,000 median home at 7.00%, a $2,193 baseline monthly payment:
- Rate drops to 6%: new payment $1,976
- Rate drops to 5%: new payment $1,770
- Prices fall another 5%: new payment $2,052
- Insurance falls 20%: new payment $2,143
- Rate to 6% plus insurance down 20%: new payment $2,793 all-in
Even the combined scenario still requires about $120,000 of income to qualify, well above what the typical Austin household earns. No single lever, and not even two together, closes that gap.
Source: Unlock MLS July 2026 Central Texas Housing Report via KXAN; Realtor.com August 2026 metro analysis; Texas Real Estate Research Center; Pew Charitable Trusts.
CHLOE'S TAKE
“People want to know if we are at the bottom. My short answer is yes because prices are holding. I try to stay out of predictions, so here is what I watch instead: pending sales still rising showing demand, and inventory under five and a half months is below a balanced market of supply. Homeowners locked into the 3% rate are not selling. If unemployment started rising, or people who bought before 2021 started to go underwater, we could see us dip further. Neither is happening today.”
Part 5: Why a good job is no longer enough
CHLOE'S TAKE
“If you already owned something in 2020, the last five years made you wealthier without you lifting a finger. If you did not, a good salary bought you less house every year while childcare and insurance took a bigger bite. A paycheck stopped being the thing that makes someone a buyer.”
Economists call this a K-shaped economy. Households that own assets went up. Households living on a paycheck went down. Average the two together and you describe nobody. Since the 1970s, housing costs rose 6.6 times faster than general inflation, healthcare 10 times faster, and childcare 14 times faster. Morgan Stanley calls childcare a second mortgage, and the math backs it: two kids in childcare costs more than a mortgage in 45 states.
Homeownership matters here because it is the most evenly spread large asset in America. Stocks are the most concentrated, with the top 20% of households holding at least 70% of them. For most families, the house is the wealth. The year you bought it is the biggest single factor in which direction your finances went.
Median household income is $90,430. Income needed to qualify is $130,000 to $153,000. A solidly middle-class income still cannot buy the median Austin house.
County medians tell you where that gap closes: Caldwell County sits at $254,000 and Travis County at about $500,000, while Redfin puts the starter-home income needed at $92,607. That metro-wide number hides a lot, because $90,000 goes a long way in Caldwell County but not in Travis. The good news is genuine too: Redfin found Austin leading the country in improving starter-home affordability, with that income figure dropping 6.1% in a year. If you are weighing where that trade-off lands for you, my neighborhood guide breaks the metro down area by area.
Source: Morgan Stanley Thoughts on the Market, September 2026; U.S. Census Bureau ACS 2024; Redfin starter-home affordability analysis 2026; Unlock MLS county medians July 2026.
Part 6: Where everybody went
CHLOE'S TAKE
“Nobody expects every New Yorker to live in Manhattan. They move to Brooklyn, to Queens, to Jersey City, and nobody calls that a collapse. Georgetown, Kyle, Buda, San Marcos are absorbing the buyer who cannot clear Travis County anymore. Austin is growing boroughs.”
Every county in the region grew between 2023 and 2024. The difference is where that growth came from. Travis County grew only 1.2%, and domestic migration was actually negative there, meaning more people moved out to other counties than moved in from them. Travis still grew because births and international arrivals more than made up the gap.
The other four counties grew faster, mostly because people moved in from elsewhere, largely from Travis:
- Williamson: +3.7% total growth, 60% of it from migration
- Hays: +3.7% growth, 72% from migration
- Bastrop: +2.6% growth, 83% from migration
- Caldwell: +4.6% growth, 83% from migration
- Travis: +1.2% growth, migration itself negative
Builders followed, and they are competing on payment
New construction made up roughly 3,800 of 14,000 active listings in March 2026, about 27% of everything for sale, nearly all of it in the suburbs. In Kyle, 53.5% of active listings are new construction; Hutto and Liberty Hill are both above half. Builders are not cutting sticker prices, which would hurt comparables across their whole community. They are buying down interest rates instead. Typical Austin incentive packages run $10,000 to $30,000, including rate buydowns of one to two points and closing cost credits of $5,000 to $20,000. If you are selling a resale home in the suburbs right now, that is your competition, and you cannot match the tool.
Building here costs more than anywhere else in Texas
- $160 to $300 cost per square foot in Austin, against $125 to $250 in San Antonio.
- $18,168 development fee per unit, the highest of the five largest Texas metros.
- Up 187% infill fee premium above the Dallas-Fort Worth, Houston and San Antonio average.
Those fees alone could eat up to 20% of the mortgage a median-income Austin renter could afford. It is one more reason what happens with zoning and permitting matters more here than most people think.
Source: U.S. Census Bureau Vintage 2024 estimates via City of Austin; USAFacts county population analysis; Unlock MLS inventory analyses 2026; Home Builders Association of Greater Austin.
Part 7: Is Austin turning into San Francisco?
CHLOE'S TAKE
“I went into this genuinely worried the data would say yes. It does not. We built 120,000 units and rents fell sixteen percent, with the biggest drops in the older buildings where working people actually live. That is the exact thing San Francisco refused to do for forty years.”
Austin's homeownership rate is 57.7%, tenth-lowest among 75 major metros. New York sits at 47.0% and San Francisco and Los Angeles at 49.0%. Austin rose from 56.0% to 57.7% in a year while San Antonio fell 4.3 points.
San Francisco became San Francisco by refusing to build. Austin did the opposite.
- 120,000 housing units added between 2015 and 2024, a 30% stock expansion against 9% nationally.
- Down 16% median rent, from $1,546 in December 2021 to $1,296 in January 2026, even as the city kept adding people.
- Down 11.4% rent drop in older non-luxury buildings, against 2.6% in luxury ones.
- About 50% of Austin-area renters still spend over 30% of income on housing.
- 92% of Gen Z households here rent rather than own. Insurance and tax pressure remain structural.
Source: SmartAsset analysis of Census data Q1 2024 to Q1 2025; Pew Charitable Trusts, March 2026.
Where things stand: the market as of late September 2026
CHLOE'S TAKE
“Two things landed in the last few weeks that change the picture. August numbers came in softer than July, and the Fed raised its rate for the first time since 2023. One thing I want to be clear about, because it gets repeated wrong constantly: the Fed does not set your mortgage rate. Those are two different numbers that sometimes move together and sometimes move opposite. A single month of sales never tells you much on its own either.”
Two rates moved, and they are not the same rate
On September 16, 2026, the Federal Reserve raised its benchmark rate by a quarter point to a target range of 3.75% to 4.00%. It was the first increase since July 2023, the vote was unanimous, and Fed projections leave room for another before year end. Inflation was running at 3.4% against a 2% target, with oil above $100 a barrel.
Mortgage rates are a separate market. The 30-year fixed tracks the 10-year Treasury yield and mortgage-backed securities pricing, which move on long-run inflation expectations rather than on Fed policy directly. In September 2024 the Fed cut by half a point and mortgage rates went up. Today the 30-year sits between 6.95% and 7.37% depending on whose survey you read: Freddie Mac at 6.95%, Bankrate at 6.97%, Mortgage News Daily at 7.19%, Zillow at 7.37%. This report uses 7.00% as a working figure.
Source: Federal Reserve FOMC statement, September 16, 2026; Freddie Mac PMMS; Bankrate; Mortgage News Daily; Zillow, September 2026.
August in Central Texas
| Measure | Aug 2026 | Year over year | Notes |
|---|---|---|---|
| Metro median price | $412,000 | −6.4% | Austin-Round Rock-San Marcos |
| Metro closed sales | 2,501 | −7.3% | Dollar volume −11.1% |
| Metro pending sales | 2,623 | +1.5% | Moving opposite to closings |
| Months of inventory | 5.1 | −0.4 mo. | Below a balanced six |
| Close-to-list ratio | 93.2% | Buyers negotiating | |
| City of Austin median | $560,000 | −4.3% | Sales −10.3% |
| Travis County median | $489,000 | −6.4% | Sales −9.5% |
| Williamson County median | $399,900 | −5.9% | Pending sales +9.3% |
Source: Unlock MLS August 2026 Central Texas Housing Report, via KVUE, CultureMap Austin, and Hoodline.
The signals inside that table point different directions: closed sales fell while pending sales rose, and inventory sits below balanced even as demand looks soft. Active listings inside the city dropped 14.5%, which reads as sellers pulling back rather than buyers rushing in.
Williamson County was the one place where pending sales climbed 9.3%, well ahead of the metro. One month is a data point. The rate move is the thing worth watching, because it undoes the affordability that falling prices were supposed to deliver.
What to do with all this
CHLOE'S TAKE
“Both things can be true. Foreclosures are up, and for the families inside that number it is painful and it is happening. And this is not 2008, it is not a crash, and it is no reason to sell a house you can afford to keep. Read the whole picture, then decide for yourself.”
A market can have rising foreclosures, rising sales, the best job growth in the country, and falling rents all at once. None of those numbers is lying. They describe different people in the same city.
If you own
The question is not whether foreclosures are up. It is when you bought, what you put down, and whether your escrow payment has changed.
If you are buying
This is the most negotiating room since 2019 in a region still adding jobs faster than its peers. New construction is competing with rate buydowns a resale seller cannot match. My complete guide to buying in Austin walks through how to use that.
If you are selling
You are pricing against a builder who can buy down a buyer's interest rate. Price to the market that exists today. The 2022 market is gone.
What would change this read
Austin unemployment rising meaningfully, negative equity spreading to pre-2021 buyers, or delinquency climbing among conventional borrowers rather than FHA and VA.
What this report does not know
- Austin foreclosure counts by price tier, borrower age, and ZIP code are not published. National and Texas patterns stand in, and are labeled where used.
- Austin negative equity estimates range from 4% to 9% depending on the provider and the month. The range is shown rather than a single number.
- A twenty-year foreclosure rate series for individual counties does not exist publicly. The national series is shown; Texas and county figures are current-period only.
- Sources define Austin differently. ATTOM uses the metro, brokerages often mean a five-county region, Unlock MLS reports city and county separately. Geography is stated wherever it changes the number.
- Payment hierarchy research disagrees on whether the car or the house comes first. Both findings are shown.
Sources
ATTOM Data Solutions year-end foreclosure market reports and July 2026 foreclosure rates by state. Unlock MLS via KXAN, Austin metro and county medians, July 2026, and the March and Q1 2026 Central Texas Housing Report. Texas Real Estate Research Center, Texas Housing Insight, August 2026. The Real Deal citing TRD Data, Austin foreclosure rank, April 2026. Realtor.com State of the Foreclosure Market, July 2026, and via Newsweek, August 2026 metro list price per square foot. U.S. Census Bureau via City of Austin, Vintage 2024 population estimates. Home Builders Association of Greater Austin development fees analysis. OneEstimate Austin construction cost per square foot, 2026. TrackingPermits Texas building permit fees by city, 2026. Rice University Kinder Institute, Texas insurance premiums versus income. Federal Reserve Bank of Dallas, Texas home insurance premium growth. Mortgage Bankers Association Q2 2026 national delinquency survey. Cotality (CoreLogic) homeowner equity insights, Q2 2026. Johns Hopkins Bloomberg School of Public Health, JAMA Network Open, January 2026. Federal Reserve Bank of New York, student loan defaults after the repayment pause and the Household Debt and Credit Report. Opportunity Austin Monthly Economic Indicators, September 2026. Morgan Stanley Thoughts on the Market, September 2026. Redfin starter-home affordability analysis, 2026. Pew Charitable Trusts, Austin construction and rents by building class, March 2026. SmartAsset via KXAN, metro homeownership rates 2024 to 2025, and via CultureMap Austin, Williamson County growth and the cost of raising a child. Travis Central Appraisal District 2026 market values and appraisal roll. Texas Tribune citing KFF, ACA marketplace premium increases, 2026. Cerulli and Visa, Great Wealth Transfer size and timing. Polygon Research, agency ARM origination share, 2026. foreclosure.com county-level distressed listing counts, September 2026. Travis County Clerk, Notice of Trustee Sale filings, primary public record. Federal Reserve FOMC statement, September 16, 2026. Freddie Mac PMMS, Bankrate, Mortgage News Daily and Zillow rate surveys, September 2026.
Compiled September 2026. Market data is current as of publication and changes continuously. Verify against live sources before relying on any figure. This report is informational and is not legal, tax, or financial advice.
Reports like this one go to my newsletter list first. Subscribe to Chloe's World and get the next one before it is public.
Thinking about your next move in Austin?


