


For 4 years, the advice at every dinner table in Austin has been the same. Wait. Prices are too high. They'll come down.
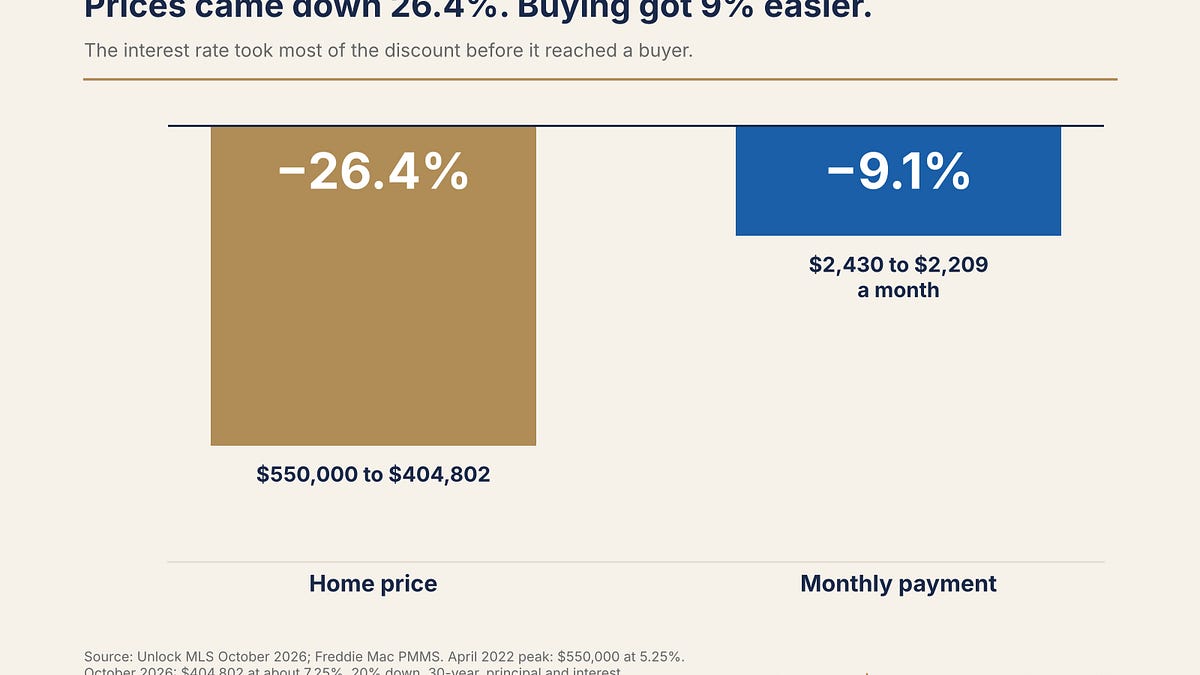
They did. The median Austin home sold for $550,000 in April 2022. This October it sold for $404,802. That's a 26.4% drop, the exact correction everyone was waiting for.
So why does buying a house still feel out of reach? It's the question I get asked most, and when I finally ran the numbers, the answer surprised me.
The math almost nobody ran
At the 2022 peak, a $550,000 home with 20% down at 5.25% cost $2,430 a month in principal and interest.
Today, a $404,802 home with 20% down at roughly 7.25% costs $2,209.
The price dropped $145,198. The payment dropped $221.
A 26.4% price correction became a 9.1% payment correction. The interest rate took most of the discount before it ever reached a buyer. That one comparison explains more about Austin right now than any headline you'll read this month.
If you were shopping for the median home at the April 2022 peak and decided to wait, it costs $221 less per month today. For those of you still waiting, this is what you have been waiting for. That is principal and interest only. Insurance and property taxes have climbed since 2022 and could close part of that gap. Part 3 has the numbers, and Part 4 explains why the market is frozen anyway.
The median Austin home, side by side
The payment on the median home drops $221 a month, even with a rate 2 points higher.
- Home price: $550,000 in April 2022, $404,802 today. Down 26.4%.
- Down payment (20%): $110,000 then, $80,960 today. Down $29,040.
- Interest rate: 5.25% then, about 7.25% today. Up 2.0 points.
- Monthly payment: $2,430 then, $2,209 today. Down $221.
If you are running this math for a purchase of your own, the complete guide to buying a home in Austin walks through the rest of the numbers.
Renting held steady
The median Austin rent was $2,100 in October, up 1.0% from a year ago. Owning the median home runs about $2,800 to $3,000 a month once taxes and insurance are in. A household doing that math is choosing between a rent that held steady and a payment that still costs $700 to $900 more.
Buying is now cheaper than it was at the peak, and renting is still cheaper than buying. Pair that with the roughly half of American mortgages that carry a rate below 4%, and the market has very little motivation on either side: owners with a 3% rate have little reason to sell, and renters have little reason to buy.
Where the Austin housing market stands this month
October gave us a headline that sounds like a break.
- The median sale price fell 6.9% to $404,802.
- Closed sales fell 11.4% to 2,114.
- Inventory reached 6.2 months, just above the balanced level of 6.
- Prices sit 26.4% below the 2022 peak.
Unlock MLS attributes the price decline to lower-priced homes making up a greater share of sales, with demand strongest between $200,000 and $299,000. The City of Austin median held flat at $550,000.
One footnote worth knowing: Unlock MLS compared this October against a restated October 2025. Against the figures originally published a year ago, sales fell closer to 5.5%, and the median fell about 7.8%. They haven't explained the revision.
There is no single Austin real estate market
That $404,802 median blends six very different places.
- City of Austin: $550,000 median, 0.0% year over year, sales down 14.6%, 5.7 months supply.
- Travis County: $480,000 median, down 4.9%, sales down 13.2%, 6.2 months supply.
- Williamson County: $375,250 median, down 9.2%, sales down 12.8%, 5.6 months supply.
- Hays County: $371,080 median, down 4.9%, sales down 8.1%, 6.9 months supply.
- Bastrop County: $348,500 median, up 7.5%, sales down 15.5%, 7.8 months supply.
- Caldwell County: $280,000 median, up 5.7%, sales up 95.8%, 10.2 months supply.
- Austin metro (MSA): $404,802 median, down 6.9%, sales down 11.4%, 6.2 months supply.
Bastrop rose 7.5% while Williamson fell 9.2%. The headline number describes none of them. If you're shopping, the only median that matters is the one for where you're shopping, which is why I keep a running read on the best neighborhoods in Austin rather than one metro average. (Hays and Caldwell recorded just 296 and 47 sales, so their medians swing on whichever houses happened to close.)
And mortgage rates moved the wrong way
The 30-year fixed averaged 7.18% in Freddie Mac's November 5 survey. After a hotter-than-expected inflation report on November 10, Mortgage News Daily had it at 7.30%. Futures markets now treat a quarter-point Fed hike on December 9 as close to certain.
Everyone spent this year waiting for cuts. The conversation has flipped to hikes. If your plan depended on rates falling, it needs a second version. These are the questions to ask your lender before you lock anything in.
Coming in Part 2
So if buying barely got easier, why did Austin foreclosure filings jump 199% this spring, the biggest increase of any city in the country? That number made a lot of people nervous. On Sunday I'll walk through what it measures, and who is behind it.
Thinking about your next move in Austin?


