


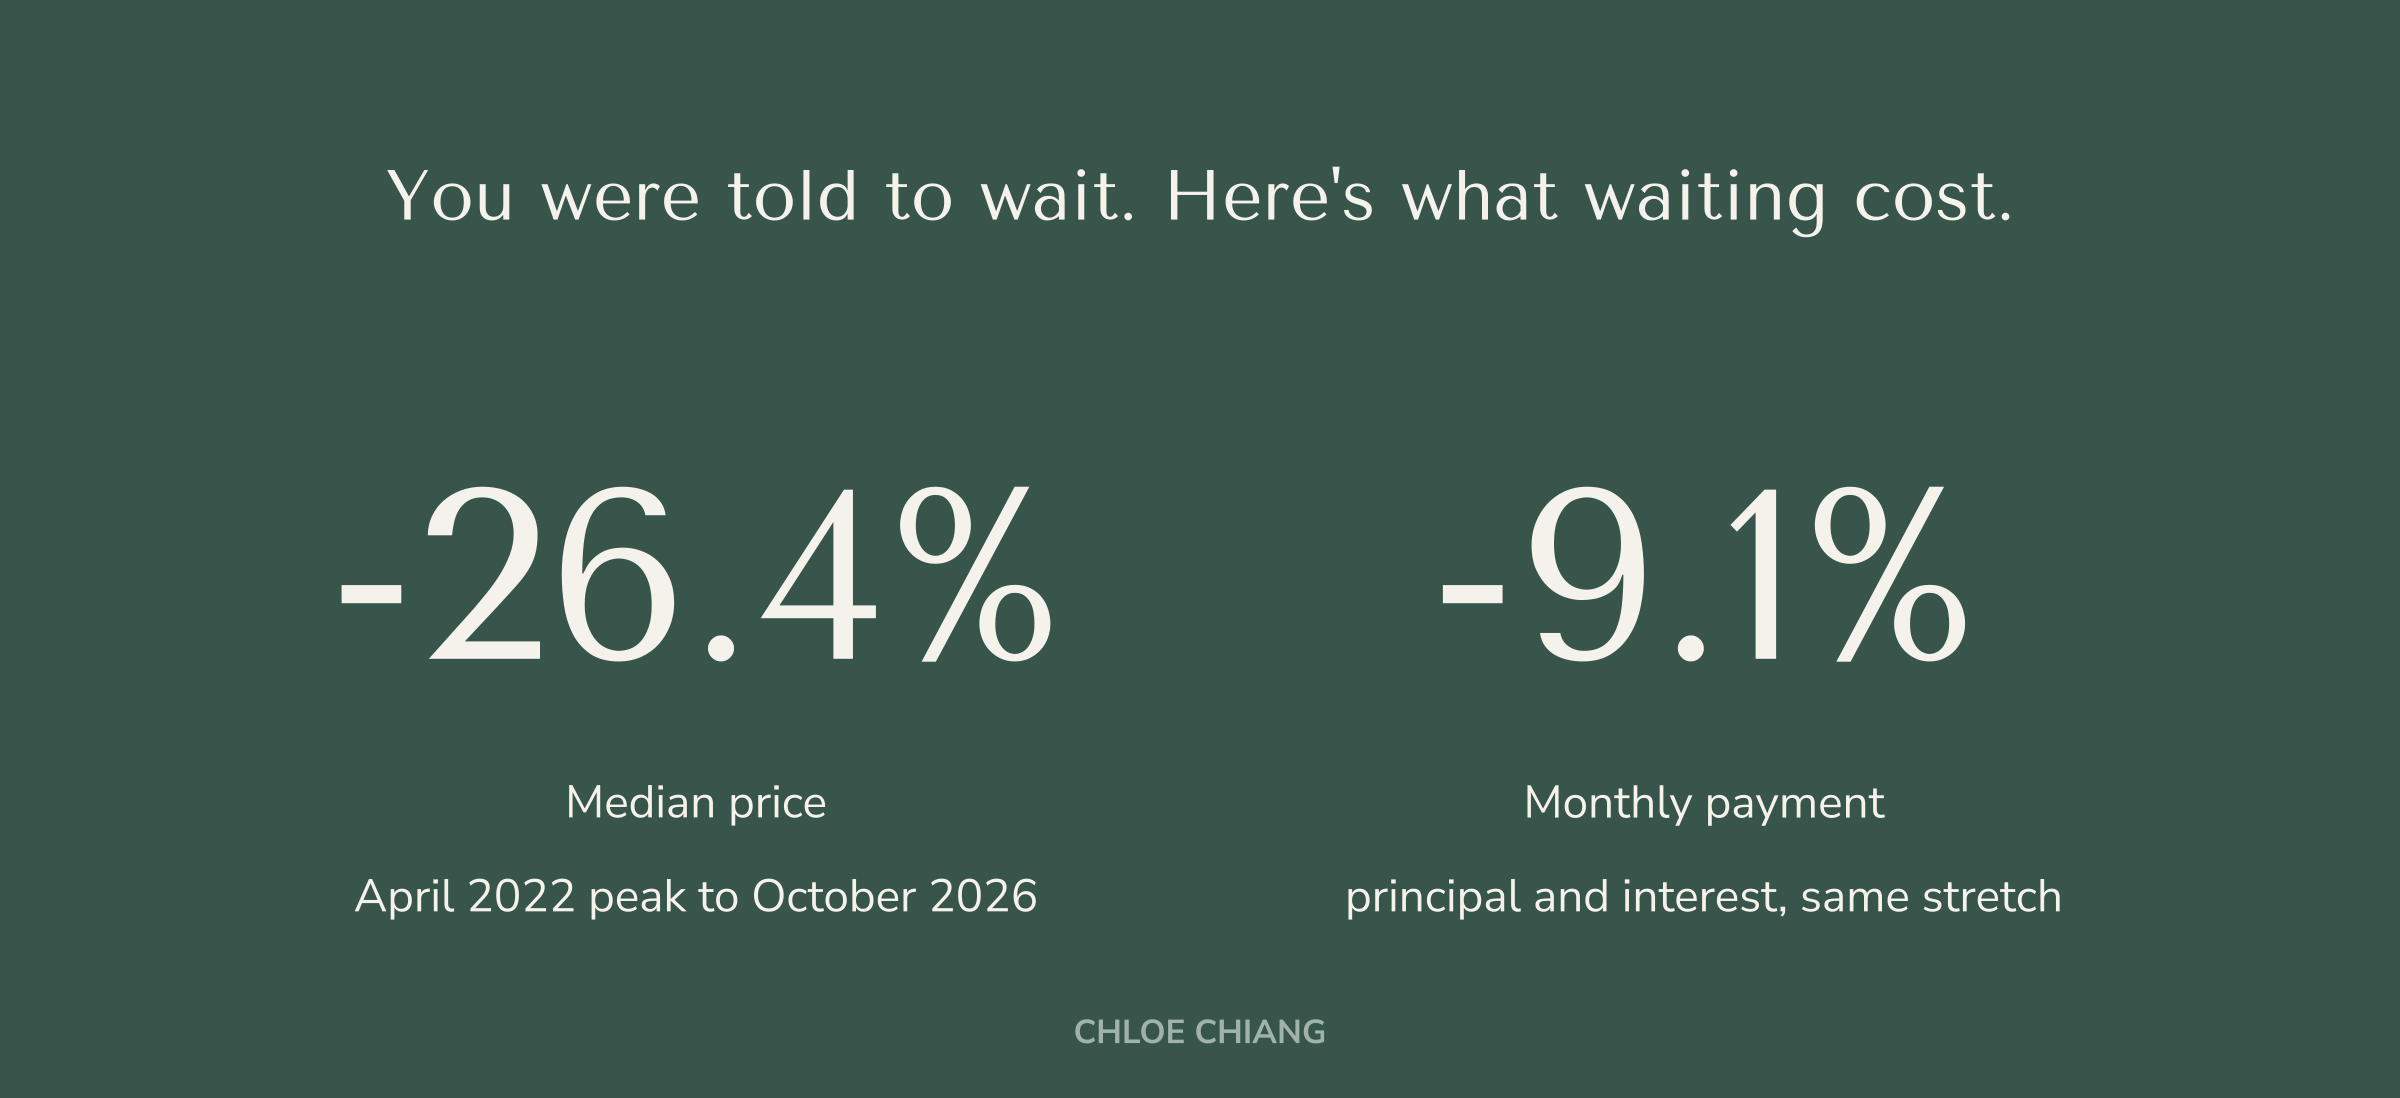
Austin prices fell 26.4% from the peak. The monthly payment fell 9.1%. Everyone who waited for the correction got one, and almost nobody felt it.
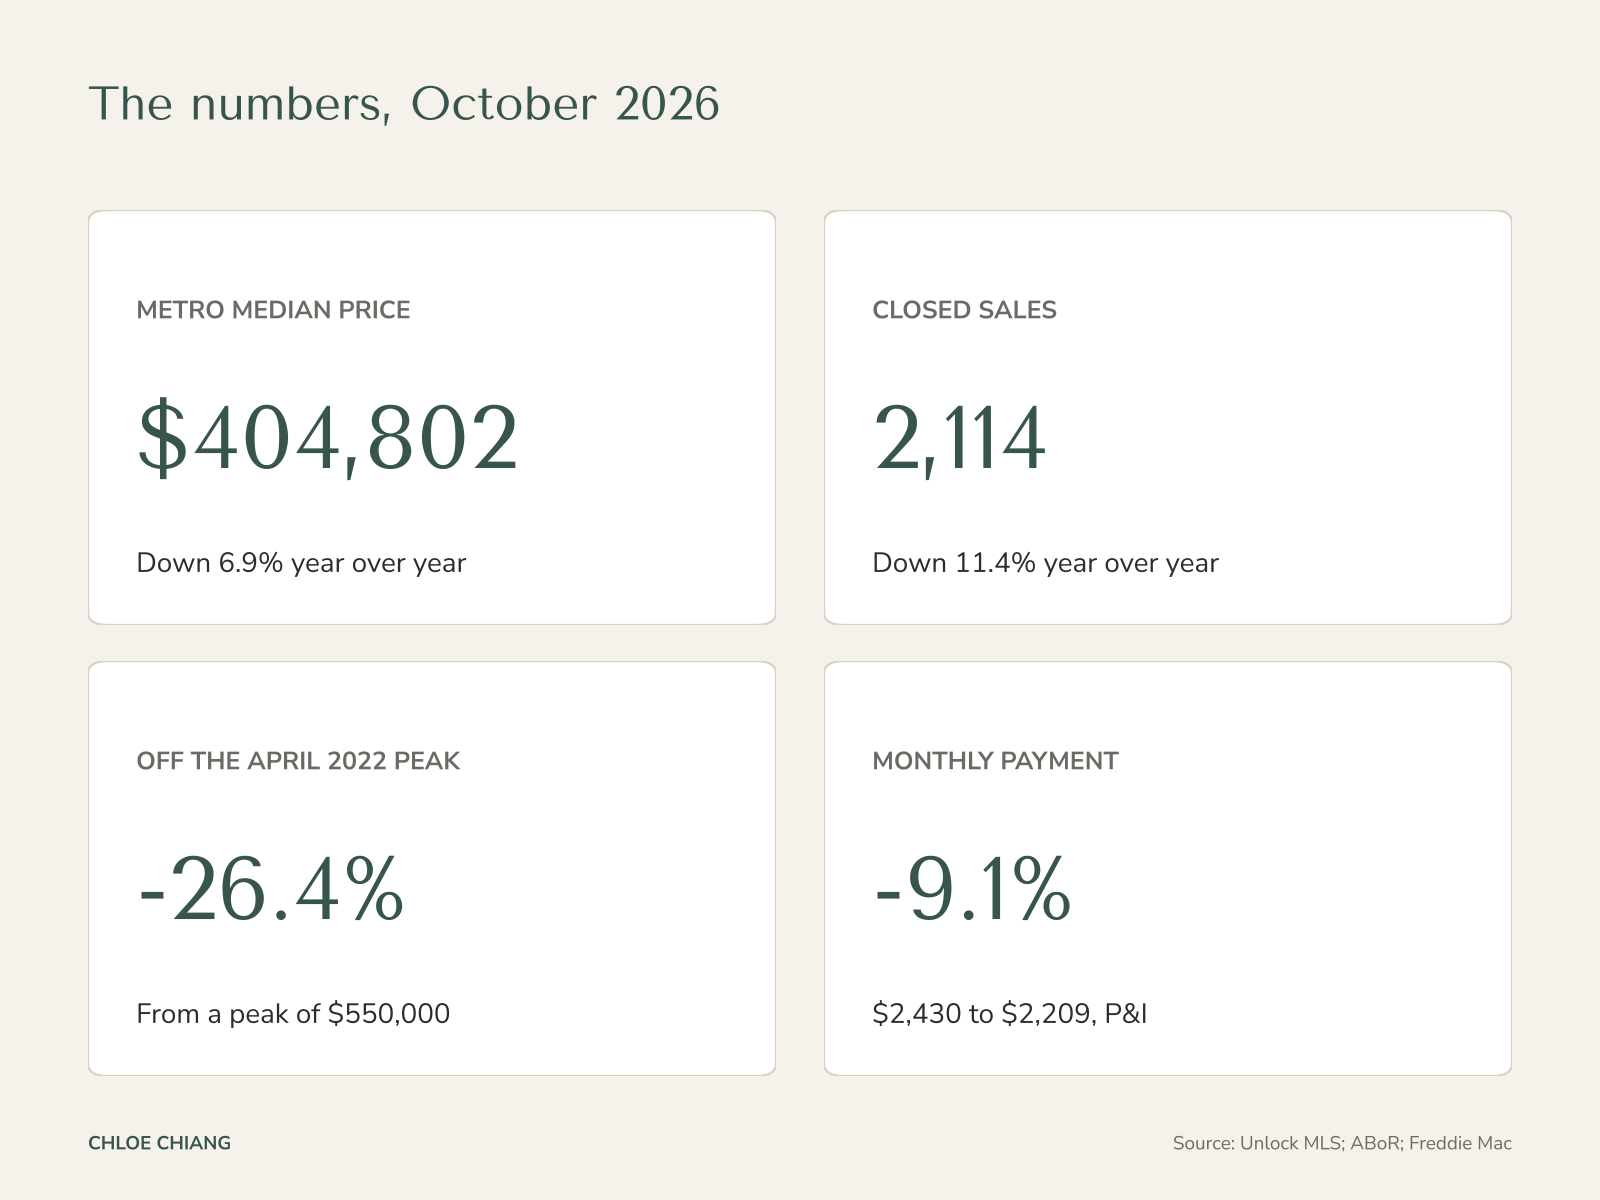
The numbers, October 2026 edition
Three things are true in Austin right now, and together they look like a crash. Foreclosures are up. The median price fell 6.9%. Sales fell 11.4%. This report works through all three, starting with the number that sounds worst.
Every market in the metro, October 2026
The metro median fell 6.9% to $404,802. Underneath it, Bastrop County climbed 7.5% while Williamson fell 9.2% and the City of Austin held flat at $550,000. There is no single Austin market, and the headline number describes none of the six.

| Market | Median price | Price YoY | Sales YoY | Months supply |
|---|---|---|---|---|
| City of Austin | $550,000 | 0.0% | −14.6% | 5.7 |
| Travis County | $480,000 | −4.9% | −13.2% | 6.2 |
| Williamson County | $375,250 | −9.2% | −12.8% | 5.6 |
| Hays County | $371,080 | −4.9% | −8.1% | 6.9 |
| Bastrop County | $348,500 | +7.5% | −15.5% | 7.8 |
| Caldwell County | $280,000 | +5.7% | +95.8% | 10.2 |
| Austin metro (MSA) | $404,802 | −6.9% | −11.4% | 6.2 |
Source: Unlock MLS October 2026 Central Texas Housing Report, released November 11, 2026. November data releases mid-December.
Two cautions on this table. Hays and Caldwell recorded 296 and 47 sales respectively. At that volume a median moves on which houses happened to close, and Caldwell's sales nearly doubled from a base of about 24. And Unlock MLS compares against a restated October 2025: measured against the figures originally published a year ago, metro sales fell about 5.5% rather than 11.4%, and the median fell about 7.8% rather than 6.9%.
Four chapters, one answer
1. Foreclosures are up. Should you worry?
Austin filings rose 199% in April 2026 from a year earlier, the largest increase of any large U.S. metro. That describes about 1 in every 2,000 Austin homes that month, against 1 in 3,388 nationally. Across a full year, 0.26% of U.S. homes had a filing in 2025, against 0.36% in 2019 and 2.23% (1 in 45) at the 2010 peak. The increase is concentrated almost entirely in people who bought at the top with 3.5% down.
Source: ATTOM; The Real Deal citing TRD Data
2. Prices fell 26.4%. Why didn't buying get easier?
The median went from $550,000 to $404,802. The monthly payment went from $2,430 to $2,209. The interest rate took most of the discount before it reached a buyer. This is the most important number in the report.
Source: Unlock MLS; Freddie Mac PMMS
3. The market is frozen, and that is different from falling.
Sales dropped 11.4% and the median fell 6.9%, which Unlock MLS attributes to lower-priced homes making up a greater share of sales. Inventory sits at 6.2 months, just above balanced. Nearly half of American mortgages carry a rate below 4%, and those owners are not trading them for 7.3%. Supply and demand froze together.
Source: Unlock MLS; Realtor.com analysis of FHFA data; Mortgage News Daily
4. Where it all connects.
The mortgage payment is the one bill that did not move. Insurance rose 74% while income rose 11%. Property taxes climb in years values fall. Childcare runs $24,891 a year. Student loans came back after a 43-month pause. Chapters 1 through 3 describe what is happening. Chapter 4 is why.
Source: Rice University Kinder Institute; Federal Reserve Bank of New York
CHLOE'S TAKE
“For 4 years people have told each other to wait for prices to come down. Prices came down 26%. The payment moved 9%. Almost nobody has run that math. Meanwhile everyone is still waiting for rates to drop, and as of this week the Fed is expected to raise them instead.”
Part One, Chapter 1: Foreclosures Are Up. Should You Worry?
The honest way to measure foreclosures is filings against every home in a market. That gives a rate you can compare across decades, which a raw count can never do. Annual rates and monthly rates measure different stretches of time, so this chapter keeps them apart.
The long view, by year. In 2025, 0.26% of American homes got a foreclosure filing, up from 0.23% in 2024. At the 2010 peak it was 2.23%, or 1 in 45. Before the pandemic in 2019, it was 0.36%, higher than today. We are near the bottom of a 20-year range.

The current view, by month. In April 2026, about 1 in 2,000 Austin homes had a filing, against 1 in 3,388 across the country. In August 2026, Texas ran 1 in 2,445 and the country 1 in 3,569. Austin runs hotter than Texas and Texas runs hotter than the country. Even if every month looked like April, a full year would reach roughly 0.6% of Austin homes, about a quarter of the 2010 national rate.

Source: ATTOM Year-End 2025, April 2026 and August 2026 U.S. Foreclosure Market Reports; The Real Deal citing TRD Data, May 2026.
A caveat on the Austin number. The 1-in-2,000 Austin figure is from April 2026 and comes from TRD Data rather than ATTOM. ATTOM publishes metro rates only for the worst-ranking metros, and Austin does not appear on those lists, so no newer Austin-specific rate has been published. Treat it as directional and dated.
Why a percentage can be true and still mislead
A rate tells you how common something is. A percentage increase depends entirely on where you started. Austin's April 2025 base was historically low because foreclosure activity had been suppressed for years by pandemic moratoriums and forbearance programs. Go from a very small number to a slightly less small number and the percentage looks enormous.
Texas also clears a foreclosure in 155 days against a 563-day national average, the fastest in the country. More properties cycle through the count here simply because the process moves faster.
CHLOE'S TAKE
“When someone shows you a foreclosure number going up, ask one question: up from what? Normal is 2019, and 2019 ran hotter than today.”
Part One, Chapter 2: Where the Market Stands Right Now
October 2026 produced a headline that sounds like a break. The median sale price fell 6.9% to $404,802. Closed sales fell 11.4% to 2,114. Inventory reached 6.2 months, just above the balanced level of 6. And prices remain 26.4% below the April 2022 peak of $550,000.

Unlock MLS attributes the median's decline to lower-priced homes making up a greater share of sales, with demand strongest between $200,000 and $299,000. The City of Austin median held flat at $550,000. A single Austin median hides which of six markets a buyer is actually shopping in, and the county table at the start of this report shows them side by side.
Source: Unlock MLS October 2026 Central Texas Housing Report, released November 11, 2026.
Read the year-over-year numbers carefully. Unlock MLS compares October 2026 against a restated October 2025. The percentages imply a 2025 base of roughly 2,386 sales and a $434,800 median, against the 2,238 sales and $439,000 median originally published a year ago. Measured against the originally published figures, sales fell about 5.5% rather than 11.4%, and the median fell about 7.8% rather than 6.9%. Unlock MLS has not explained the revision. It made a similar restatement in September.
Rates went up, and the Fed is now expected to raise again
The 30-year fixed averaged 7.18% in Freddie Mac's November 5 survey after peaking at 7.40% in early October. Mortgage News Daily's daily measure jumped to 7.30% on November 10 following a hotter-than-expected inflation report. October CPI rose 0.4% month over month against a 0.3% consensus.
The Federal Reserve held its benchmark at 3.75% to 4.00% on October 28, with two members dissenting in favor of a hike. As of November 11, futures markets treat a quarter-point increase at the December 9 meeting as close to certain, with 10% to 15% odds of a half point. That is market pricing, not a Fed decision.
Source: Freddie Mac PMMS; Mortgage News Daily; Bureau of Labor Statistics; CME FedWatch via CNBC and The Hill.
One number you will not find. The Bureau of Labor Statistics published no official 12-month inflation rate for October, because October 2025 data was never collected during the 2025 government shutdown. Any "October inflation is X%" headline is an estimate, not an official figure.
CHLOE'S TAKE
“Prices down on paper, sales down, rates up, inventory just past balanced. That combination confuses people because it does not fit either story they have been told. The market is reorganizing around who can still qualify.”
Part One, Chapter 3: Who Is Actually in Trouble
Nationally: the loan type does most of the work
FHA loans let buyers in with 3.5% down. That is the entry ramp to homeownership for a lot of families, and it also means no cushion if prices dip. Across the country, FHA delinquency reached 11.79% in mid-2026 against 2.72% on conventional loans. FHA and VA borrowers account for about three-quarters of all underwater U.S. mortgages.

The national picture also explains why 2026 looks nothing like 2008. Back then 22.8% of mortgaged U.S. homes were underwater. Today about 1.9% are, and the average American homeowner with a mortgage holds roughly $310,000 in equity. Someone with equity who hits hard times sells the house. Someone underwater has no exit and defaults.
Source: Mortgage Bankers Association Q2 2026 National Delinquency Survey (seasonally adjusted); Cotality Homeowner Equity Insights, mid-2026.
In Austin: where those loans actually sit
The FHA ceiling for the Austin metro is $571,550. The Austin metro median is $404,802 and the City of Austin median is $550,000. FHA lending therefore lands in the suburbs and the entry-level tier, which is exactly where the local distress shows up.
Everyone who bought in a given year walked into the same prices and the same interest rates. Roughly 65% of Austin's FHA loans originated in 2022 are underwater today. An Austin buyer from 2019 is sitting on years of gains instead.
Source: HUD 2026 FHA loan limits; Unlock MLS October 2026; Foreclosure Data Hub Austin FHA analysis, June 2026.
Worth watching: national figures. Negative equity is low but rising, and these are U.S. numbers, not Austin ones. Cotality, which tracks property deeds and mortgage filings from county records, counts underwater homeowners up more than 500,000 between July 2025 and September 2026. ICE Mortgage Technology, which analyzes loan-servicing data, counted 320,000 American homes both underwater and behind on payments as of August 2026, roughly double the year before. The level is still historically low. The direction is worth tracking. No Austin-specific equivalent is published.
CHLOE'S TAKE
“If you bought before 2020, or you put 20% down, you are almost certainly not in this group. That describes most homeowners in this city. The people in trouble are a narrow slice who bought at the top with the smallest down payment the bank would accept, and the market moved against them before they built any cushion.”
Part Two, Chapter 4: What Actually Broke Them
Chapters 1 through 3 described three things that look unrelated: foreclosures rising, prices softening, sales falling. This chapter is the explanation.

- Texas home insurance premiums rose 74% between 2009 and 2024 after adjusting for inflation. Median household income rose 11%. Premiums now consume 4.6% of median household income in the typical Texas county, up from 2.9%. The Dallas Fed found the median Texas homeowner paying 60% more in 2024 than in 2019, against 30% nationally.
- Travis County's effective property tax rate runs between 1.65% and 2.07%, producing an average bill near $10,800. Texas caps homestead appraisal increases at 10% a year. Because assessed values lagged during the boom, many homes are still catching up, so the bill can rise in a year the market falls.
- Texas insurers requested an average 24% increase for 2026 marketplace health plans. A Johns Hopkins study found people with medical debt had a 44% higher risk of housing instability the following year.
- Austin is the most expensive metro in Texas to raise a child at $24,891 a year.
- Federal student loan payments restarted after a 43-month pause, and more than 3.6 million borrowers have defaulted.
Source: Rice University Kinder Institute and Texas 2036; Federal Reserve Bank of Dallas; Travis Central Appraisal District; Moon et al., JAMA Network Open, January 2026; SmartAsset; Federal Reserve Bank of New York.
The signal underneath
Household debt reached $19.1 trillion in the third quarter of 2026, with credit card balances at a record $1.29 trillion. The share of card balances newly falling 90 days behind ran 6.87%, slightly below the 7.05% of a year earlier.
The pattern that matters is the same across credit cards and mortgages: new delinquencies are flat or falling while deep delinquencies rise. A temporary income shock does not behave that way. A permanent cost increase does. A job loss gets cured when you are rehired. An insurance premium that rose 74% never comes back down.
Source: Federal Reserve Bank of New York Household Debt and Credit Report, Q3 2026, released November 10, 2026.
CHLOE'S TAKE
“Somebody who bought in 2022 with a fixed-rate mortgage did not get a rate increase. They got an insurance increase, a tax increase, a childcare increase, a health premium increase, and a student loan payment that reappeared after three years. Their mortgage payment is identical to the day they signed. Their escrow went up every single year.”
Part Two, Chapter 5: Prices Fell 26.4%. Buying Only Got 9% Easier.
At the April 2022 peak, the median Austin home cost $550,000. At 5.25% with 20% down, that is $2,430 a month in principal and interest. In October 2026 the median was $404,802 at roughly 7.25%, which comes to $2,209. The price dropped $145,198. The payment dropped $221.
The cash to get in dropped too. At 20% down, the median home required $110,000 up front at the April 2022 peak. Today it requires $80,960, which is $29,040 less.

A 26.4% price correction delivered a 9.1% payment correction. The interest rate ate most of the discount before it reached a buyer. That is the cleanest explanation for soft demand in this entire report.
If you were shopping for the median home at the April 2022 peak and decided to wait, it costs $221 less per month today. For those of you still waiting, this is what you have been waiting for. That is principal and interest only. Insurance and property taxes have climbed since 2022 and could close part of that gap, and Chapter 4 has the numbers.
And renting stayed cheaper
The Austin metro median rent was $2,100 in October, up 1.0% year over year. Owning the median home costs roughly $2,800 to $3,000 a month once taxes and insurance are included. A household running the math is choosing between a rent that held steady and a payment that still costs $700 to $900 more.
Buying is now cheaper than it was at the peak, and renting is still cheaper than buying. Pair that with the nearly half of American mortgages that carry a rate below 4%, and the market has very little motivation on either side: owners with a 3% rate have little reason to sell, and renters have little reason to buy.
Source: Unlock MLS October 2026; Freddie Mac PMMS; ABoR April and May 2022 Central Texas Housing Market Reports. The owning-cost range carries over the September edition's tax and insurance assumptions and shifts down by the $89 drop in principal and interest.
On the peak figure. The $550,000 all-time record was first set in April 2022 and matched in May. Earlier versions of this report described the correction as "about 25%," which was accurate when the median sat at $412,000 in August, and as 23.5% at September's $421,000. At October's $404,802 the correction is 26.4%.
CHLOE'S TAKE
“This is the question I get most, and the answer surprised me when I ran the numbers. Prices came down 26%. Buying got about 9% easier. Most buyers never felt the correction at all, because the rate took it before they got there. If you are waiting for one rate cut to fix this, look at that math again. Nothing here gets solved by one number moving.”
Part Two, Chapter 6: Frozen, With a Softer Median
October produced a combination that confuses everyone: closed sales fell 11.4% and the median fell 6.9%. Markets are supposed to clear. When demand drops that hard, price usually follows, and this month it did on paper. Unlock MLS attributes the decline to lower-priced homes making up a greater share of sales. The City of Austin median held flat at $550,000.
Supply dropped too. Active listings fell 2.2% year over year and new listings fell 14.3%. Inventory sits at 6.2 months, just above the balanced level of 6, because sales fell faster than listings. Fewer buyers chased fewer homes. Year-to-date sales are still up 2.5% on 2025, so the freeze is recent.
Why sellers stopped listing
Nearly half of American mortgages carry an interest rate below 4%: 49.1% in the second quarter of 2026, according to Realtor.com's analysis of the FHFA National Mortgage Database. Selling means giving that up and borrowing again at 7.3%. On a $300,000 loan, that is $1,265 a month at 3% and about $2,018 at 7.11%, a $753 difference. For most owners the math does not work at any price, so they stay put. That is the lock-in effect, and it is the single biggest reason new listings keep shrinking in a market with soft demand.
The result is a market where very little happens. Sellers hold because nothing forces them to sell. Sales fall because little is listed and few can qualify. Both numbers are accurate and neither describes a crash.
Renting adds to the freeze. With median rent at $2,100 and owning the median home running $700 to $900 more, many households have a reason to stay in the rental they have.
Where buyers are gaining ground
Homes closed at an average of 92.2% of list price in October, and pending resale contracts rose 6% while overall pending sales fell 4.0%. Unlock MLS says builders' price cuts and rate buydowns may be giving them a narrowing advantage. Mid-October MLS data showed 72.17% of Austin homes selling below list price, up from 67.71% a month earlier, with only 9.18% selling above list (Team Price Real Estate, from Austin-Area MLS). Month over month, the negotiation inside each transaction moved toward the buyer, though year over year closing prices are slightly firmer (92.2% against 91.6% in the metro).

Closing prices sit furthest below list in Caldwell and Bastrop, and a little closer to list than a year ago in the metro overall.
Source: Unlock MLS October 2026 Central Texas Housing Report; Team Price Real Estate; Realtor.com Q2 2026 analysis of FHFA data; Freddie Mac PMMS. The payment comparison is an illustration of principal and interest on a $300,000 30-year loan.
CHLOE'S TAKE
“Frozen is the word I would use. Sellers who locked a 3% rate are staying put, buyers who need a 7% loan cannot stretch, and the handful of deals that do happen are getting negotiated harder than the list prices suggest. If you have cash or flexibility right now, you have more room to push in Hays, Bastrop and Caldwell than anywhere else in the metro. In the City of Austin, a flat median and under 6 months of supply mean sellers still hold some cards.”
Part Two, Chapter 7: It Is Not the Job Market
Austin ranked No. 1 among the top-50 U.S. job markets for job growth in 2025, adding 27,200 jobs. Austin's unemployment rate was 3.7% in September 2026, unchanged from a year earlier and below both Texas at 4.4% and the nation at 4.2%. The number of unemployed Austin residents was 57,400, slightly below the 57,800 of September 2025.
Payroll growth has slowed. The metro added about 12,900 jobs over the 12 months through September, roughly 0.9%, down from the 2.0% pace of 2025. Layoffs at individual tech employers hit the people affected hard, and did not show up as a net regional loss.
Texas A&M's research center found Austin outperforming every other major Texas metro on year-to-date sales pace, running 7.8% ahead of 2025 while Houston trailed at negative 1.2%.
Source: Texas Workforce Commission, October 2026; Opportunity Austin; Texas Real Estate Research Center, October 2026.
CHLOE'S TAKE
“Every time foreclosures come up, somebody blames tech layoffs. That is a story in one sector. It does not describe Austin as a whole. Hiring slowed. It did not stop.”
Part Two, Chapter 8: Where Everybody Went
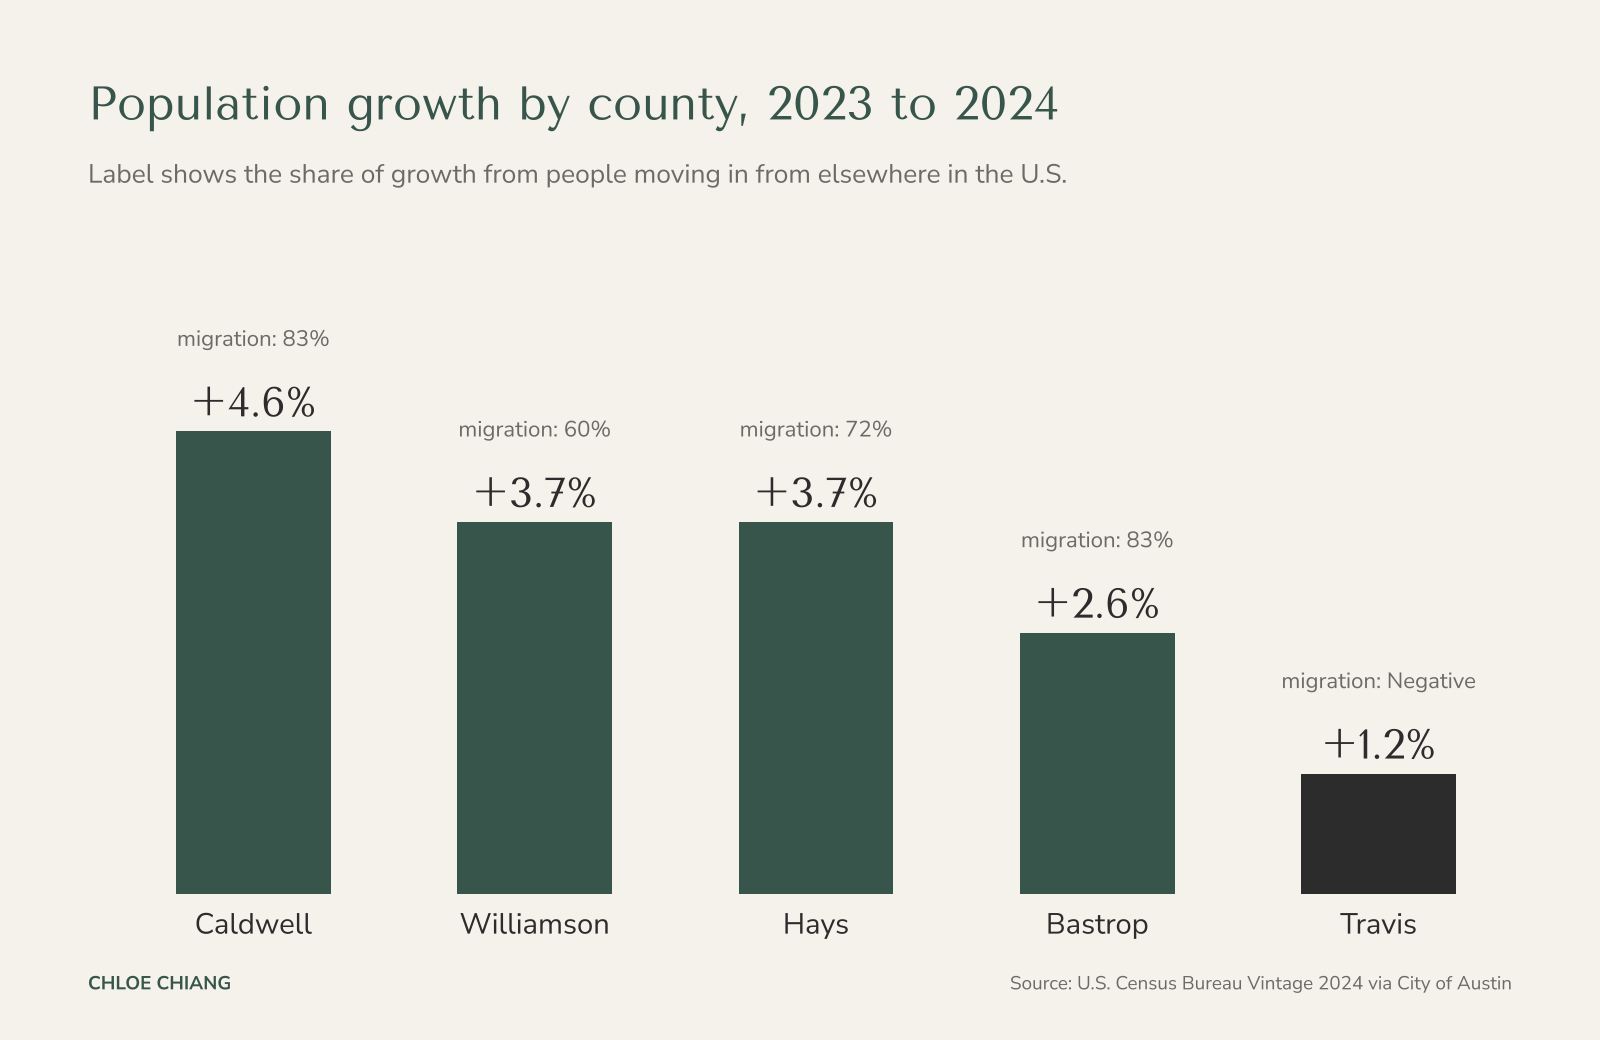
Every county in the region grew between 2023 and 2024. The difference is where that growth came from. Travis County grew 1.2%, and domestic migration was negative there, meaning more people moved out to other counties than moved in. Travis still grew because births and international arrivals made up the gap. The city demographer has said Travis could have shrunk outright without them.
The other four counties grew faster, and mostly because people moved in from elsewhere, largely from Travis. Domestic migration accounted for 60% of Williamson's growth, 72% of Hays', and 83% of both Bastrop's and Caldwell's.
Builders followed, and they compete on payment
New construction made up roughly 27% of active listings in early 2026, nearly all of it in the suburbs. In Kyle, 53.5% of active listings were new construction. Builders are keeping sticker prices where they are, because cuts would hurt comparable sales across their communities. They are buying down interest rates instead, with typical packages running $10,000 to $30,000. If you are selling a resale home in the suburbs, that is your competition. For how the two compare side by side, see new construction vs. resale in Austin.
Source: U.S. Census Bureau Vintage 2024 estimates via City of Austin; USAFacts; Unlock MLS inventory analyses 2026.
CHLOE'S TAKE
“Nobody expects every New Yorker to live in Manhattan. They move to Brooklyn, to Queens, to Jersey City, and nobody calls that a collapse. Georgetown, Kyle, Buda and San Marcos are absorbing the buyer who cannot clear Travis County anymore. Austin is growing boroughs.”
Part Three, Chapter 9: What Changed in November
Two things landed in the first half of November that will shape 2027, and both are too new to have moved the housing data yet.
The election
Democrats won control of both chambers of Congress. In Texas, Gina Hinojosa defeated Governor Greg Abbott and James Talarico defeated Ken Paxton for the U.S. Senate seat, the first Democratic Senate win in Texas since 1988. Democrats won every statewide executive office on the ballot and took the Texas House for the first time in more than two decades. Republicans kept the Texas Senate.
In Austin, Proposition I failed. City Council Districts 1, 3 and 5 head to runoffs on December 12. Travis County set a midterm early-voting record with 449,556 early ballots.
A divided Texas Capitol means property tax relief, local zoning preemption and school finance all become negotiated questions in the 2027 session rather than settled ones. No housing policy has changed yet.
Source: Associated Press and network results; KUT; Axios Austin; Travis County Clerk via Community Impact. Results are unofficial until canvass and certification.
What the election did not do. Mortgage rates drifted lower through November 9, and Mortgage News Daily attributed that to tech-stock movement and falling oil prices rather than the election. The decisive rate event since then was the November 10 inflation report, which pushed rates up. No documented analysis ties a mortgage-rate move to the election result.
The rate outlook flipped
For most of 2026 the open question was when the Fed would cut. After the October inflation reading, the question became how much it will raise. Dallas Fed President Lorie Logan said on November 10 that she sees a need for two additional quarter-point increases. Governor Christopher Waller argued a December hike is warranted and said a larger move should be considered.
For an Austin buyer, that means the affordability math in Chapter 5 is more likely to get worse before it gets better.
Source: Federal Reserve officials' public remarks, November 2026; CME FedWatch.
CHLOE'S TAKE
“I am not going to predict what rates do. What I will say is that everybody spent this year waiting for cuts, and the conversation has now flipped to hikes. If your plan depended on rates falling, that plan needs a second version.”
Conclusion: What This Means for You
A market can have rising foreclosures, a falling median price, falling sales, the best job growth in the country and steady rents all at once. Every one of those numbers is accurate. They describe different people living in the same city.
| If you | The question that matters |
|---|---|
| Own your home | When you bought, what you put down, and whether your escrow payment has changed. |
| Are buying | Whether you are comparing a resale home against new construction that can buy down your rate. Those are different products at the same price. |
| Are selling | You are pricing against a builder with a financing tool you do not have. Price to the market that exists today. |
| Are waiting | What specifically you are waiting for. A quarter-point rate cut moves the payment by about $55 a month on a median home. |
What would change this assessment: Austin unemployment rising meaningfully, negative equity spreading to people who bought before 2021, or delinquency climbing among conventional borrowers rather than FHA and VA. None of those is visible today. All three are worth watching.
CHLOE'S TAKE
“4 years of waiting produced a 26% discount that almost nobody could use. That is the part I keep coming back to. The people who waited were right about prices and wrong about what it would buy them. And the ones who got hurt were never the cautious ones. They were the families who moved first, with 3% down, right at the top.”
Appendix: What This Report Does Not Know
- Austin foreclosure counts by price tier, borrower age, and ZIP code are not published. National and Texas patterns stand in, and are labeled where used.
- No current Austin-specific foreclosure rate exists. ATTOM publishes metro rates only for the worst-ranking metros, and Austin does not appear on those lists. The April 2026 figure of 1 in 2,000 is the most recent published.
- Annual and monthly foreclosure rates are not interchangeable. Chapter 1 compares annual rates with annual rates and monthly rates with monthly rates.
- Unlock MLS restated its September 2025 and October 2025 figures without explanation. Year-over-year percentages in this report are quoted as published, with the discrepancy noted in Chapter 2.
- Unlock MLS attributes the October median decline to a shift toward lower-priced sales. The release does not publish a median by price tier, so the size of that mix effect is not quantified here.
- The $2,800 to $3,000 owning-cost range carries over the September edition's tax and insurance assumptions and adjusts only for the lower principal and interest payment.
- Payment figures use 20% down and a rate of roughly 7.25%, between Freddie Mac's 7.18% and Mortgage News Daily's 7.30%. The lock-in illustration in Chapter 6 uses Freddie Mac's 7.11% from November 12.
- Cotality labels its mid-2026 negative equity figure 1.9%. Other sources cite 2.1% for a different measure. The lower figure is used here and the conflict is noted.
- ATTOM's September and Q3 2026 foreclosure reports, the MBA's Q3 delinquency survey, and Cotality's Q3 equity report had not published as of November 11, 2026. August and Q2 figures are used with their original dates.
- Election results are unofficial until canvass and certification.
Sources
- Unlock MLS / Austin Board of Realtors: October 2026 Central Texas Housing Report, released November 11, 2026; September 2026 and Q3 2026 Central Texas Housing Report, released October 13, 2026.
- Austin Board of Realtors: April 2022 Central Texas Housing Market Report, establishing the $550,000 record.
- Texas Real Estate Research Center: Texas Housing Insight, October 2026 edition.
- ATTOM Data Solutions: April 2026 U.S. Foreclosure Market Report; Year-End 2025 report; August 2026 U.S. Foreclosure Market Report.
- The Real Deal citing TRD Data: "Sun Belt metros post highest growth in foreclosures in April" and "Residential foreclosures tick up in Austin."
- Mortgage Bankers Association: Q2 2026 National Delinquency Survey, delinquency by loan type.
- Cotality (CoreLogic): Homeowner Equity Insights, negative equity and average equity per borrower.
- Realtor.com: Q2 2026 analysis of the FHFA National Mortgage Database, share of outstanding mortgages by rate.
- Federal Reserve Bank of New York: Household Debt and Credit Report, Q3 2026, released November 10, 2026.
- ICE Mortgage Technology: Mortgage Monitor, U.S. homes underwater and behind on payments, August 2026.
- HUD: 2026 FHA mortgage limits for the Austin-Round Rock-San Marcos metro.
- Team Price Real Estate: Austin-Area MLS mid-October 2026 share of homes selling below list price.
- Freddie Mac: Primary Mortgage Market Survey, weekly 30-year fixed rate.
- Mortgage News Daily: Daily mortgage rate index, November 10, 2026.
- Bureau of Labor Statistics: Consumer Price Index, October 2026, released November 10, 2026.
- CME FedWatch via CNBC and The Hill: December 9 rate-hike probabilities, November 10 and 11, 2026.
- Rice University Kinder Institute: Texas homeowners insurance premiums against income, 2009 to 2024.
- Federal Reserve Bank of Dallas: Austin Economic Indicators and Texas insurance premium growth.
- Texas Workforce Commission: Austin MSA unemployment and payroll employment, September 2026.
- Opportunity Austin: Austin region job growth and monthly economic indicators.
- Johns Hopkins Bloomberg School of Public Health: Medical debt and housing instability, JAMA Network Open, January 2026.
- U.S. Census Bureau via City of Austin: Vintage 2024 population estimates and components of change by county.
- Travis Central Appraisal District: 2026 market values and appraisal roll.
- KUT Austin: Travis County 2026 election results.
- Axios Austin: Austin City Council 2026 election results and runoffs.
Prepared by Chloe Chiang, eXp Realty. Data current as of November 11, 2026. Market data changes continuously; verify against live sources before relying on any figure. This report is informational and is not legal, tax, or financial advice.
Thinking about your next move in Austin?


